Google’s Chrome like any browser has developers and Webmasters tools. This menu can be accessed from the Controls for the page button available on the top right corner near to settings button. But there are also shortcuts to access these tools. Here is the list of developer and webmasters tools and shortcuts.
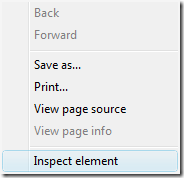
1. Inspect Element- Right-click any component on a webpage and select Inspect Element. This will open a dialog box which shows you the elements and resources associated with that component.
This can also be accessed from menu by selecting Developer-> Javascript Console.
2. Javascript Debugger- This can be accessed from Developer-> Debug Javascript. This is a command-line JavaScript debugger.
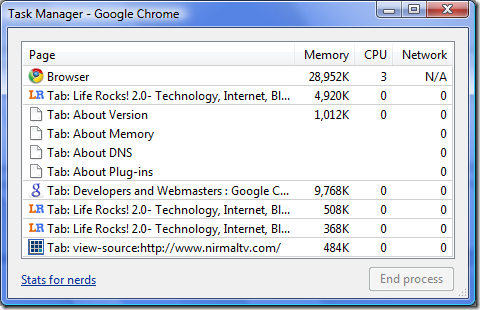
3. Task Manager- Unlike other web browsers, Google Chrome is different in the way that it has a Task manager for all tabs open, which shows the memory consumption of each tab. The shortcut for Task Manager is Shift + Esc.
4. Similar to about:config in Firefox, Chrome also has some shortcuts for developers. They are;
- about:
- about:dns
- about:plugins
- about:memory
- view-cache:[URL]
- view-source:[URL]
About: plugins gives information about the plugins installed and about:memory provides details on memory consumption of tabs. Another good shortcut is view-source and the URL, which gives the source code of the URL.




If you love Chrome’s stripped down Web Inspector, you will love the full featured version in the WebKit nightlies! Cheers!