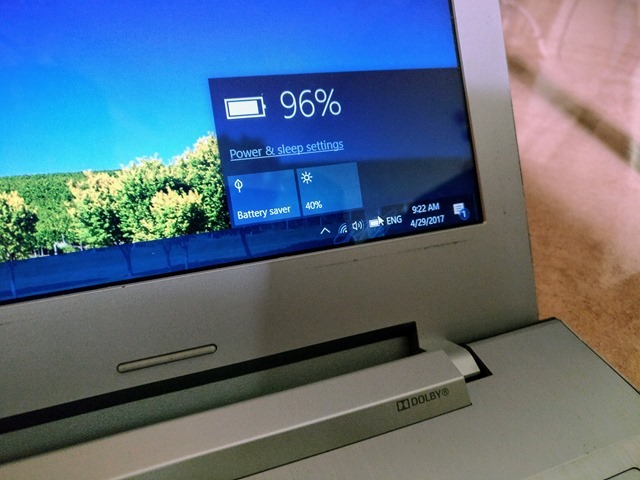
Most of the modern laptops have pretty good battery performance with good optimized hardware, but over a period of usage you might see a drop in battery performance and the maximum time on battery gets reduced after 1 or 2 years of usage. The battery capacity also gets worn down over a period of usage. So in case you are getting low battery on your laptop, then it is better to check the battery health report on Windows PC. The battery health report provides detailed analysis on the battery performance of your laptop.
In this post, we will show you how to get the battery health report on Window 10 and interpret the report.
Generating a Battery Health Report:
In order to generate the battery report, you need to open command prompt in administrator mode. Open the start menu and type command. You can see command in the search results, right click on the command and select “Run as administrator”. This will open the command prompt in administrator mode.
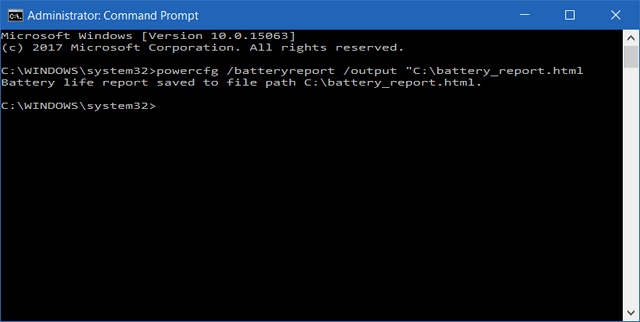
In the command prompt, type the below command and press enter.
powercfg /batteryreport /output “C:\battery_report.html
Here, you are generating the battery report in C drive, you can set the destination of report. Once the report is generated, you get the confirmation in command prompt.
Now, you can open the drive/folder set by you for saving the report. You can see an html file with the name battery_report. Open this file and it will show the report in your browser.
The battery report has multiple sections and let’s analyse each section to get an idea on the battery health of your laptop.
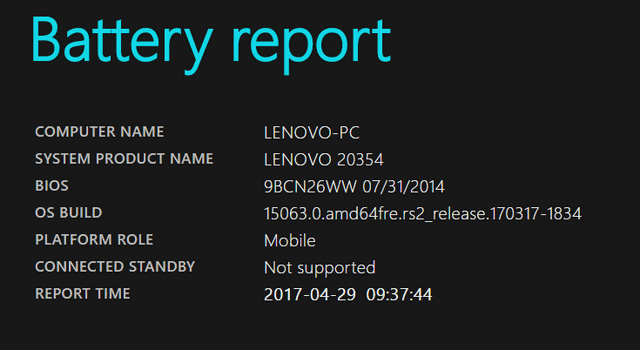
The first section shows your PC name, product name, BIOS, OS build and other details. These are self explanatory.
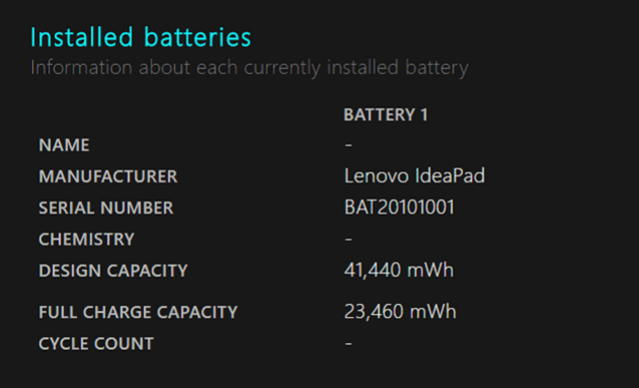
The next section is about installed battery on your device. Ideally there will be only one battery on your laptop and it includes the battery details including serial number, manufacturer details, design capacity and full charge capacity. Here you need to understand 2 important aspects, the design capacity and full charge capacity. The design capacity is the actual capacity of the battery it was designed for. Over the period of usage, the design capacity gets worn out and the full charge capacity gets reduced. In the above screen you can see that the battery was designed for a capacity of 41440mWh, but right now the capacity available is only 23460 after almost 2.5 years of usage.
This capacity will go down over a period of usage. The cycle count is actually the number of cycles charged with the battery.
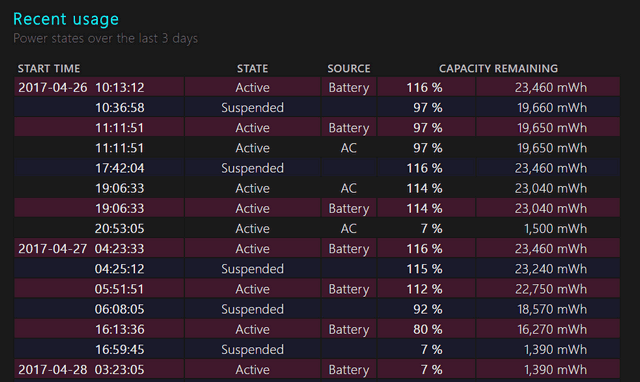
The recent usage section of the battery report shows your usage in the last 3-4 days, the time you charged the battery, how long it lasted, the suspended state and capacity remaining time etc. Using this report, you can actually check the time you are getting on the battery usage.
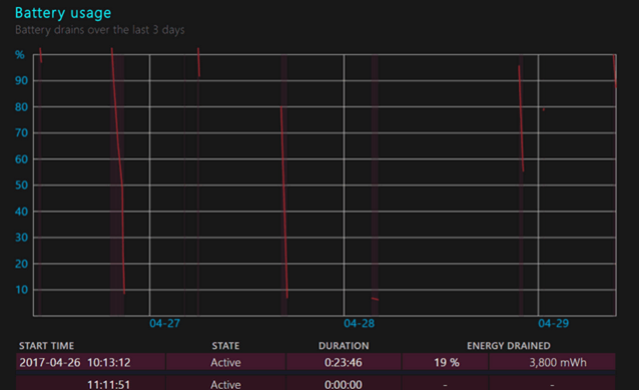
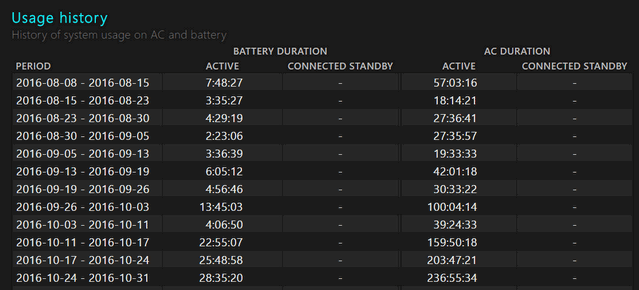
The battery usage chart shows you the graphical battery drain for past few days. The next option in the report is the usage history which shows the battery’s usage and duration over time. You can see how much time the device was on battery power and how much time it was plugged into a power source.
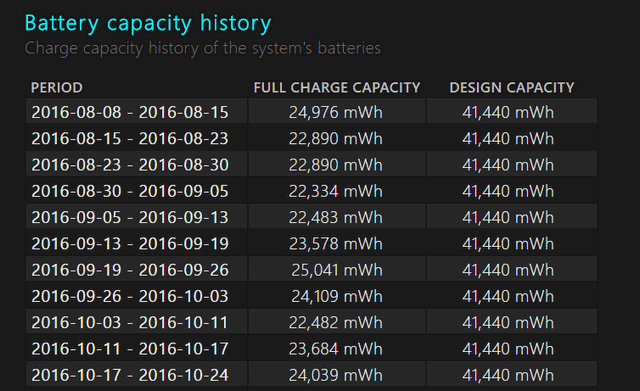
There is also a battery capacity history figures which shows how much wear has happened to the battery capacity over the days of usage. You can actually see the full charge capacity decrease over a period of time against the design capacity.
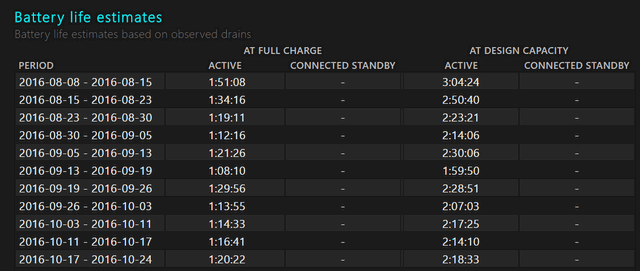
The last section in this report is Battery life estimates. In this chart, it provides an estimate of your device’s average battery life for different time periods based on how you actually used it. Here it actually compares the values achieved with the theoretical battery life at its design capacity.
The battery health report is actually a good way to access how the battery has been performing and it also can give an idea as to when you might want to think of replacing the battery on your device.



My design capacity is 62000 mWh. My full charge capacity has dropped to 15000 mWh after years of use. Guess it’s time to finally replace it haha.