Google Chrome is the most popular web browser right now across various platforms. Google has been adding features to the browser along with the performance improvements. A relatively new feature coming to Chrome is the option to check the memory usage of tabs. Each tab on Chrome browser will take up memory based on the content it shows, some pages take up a lot of memory and this can be an issue in systems with lower RAM. In such cases, you can check the memory usage of tabs in Chrome and take the necessary steps to close them. Here is how to do it.
Related Reading: How to Fix Virus Scan Failed Error in Google Chrome

How to Check Memory Usage of Tabs in Google Chrome:
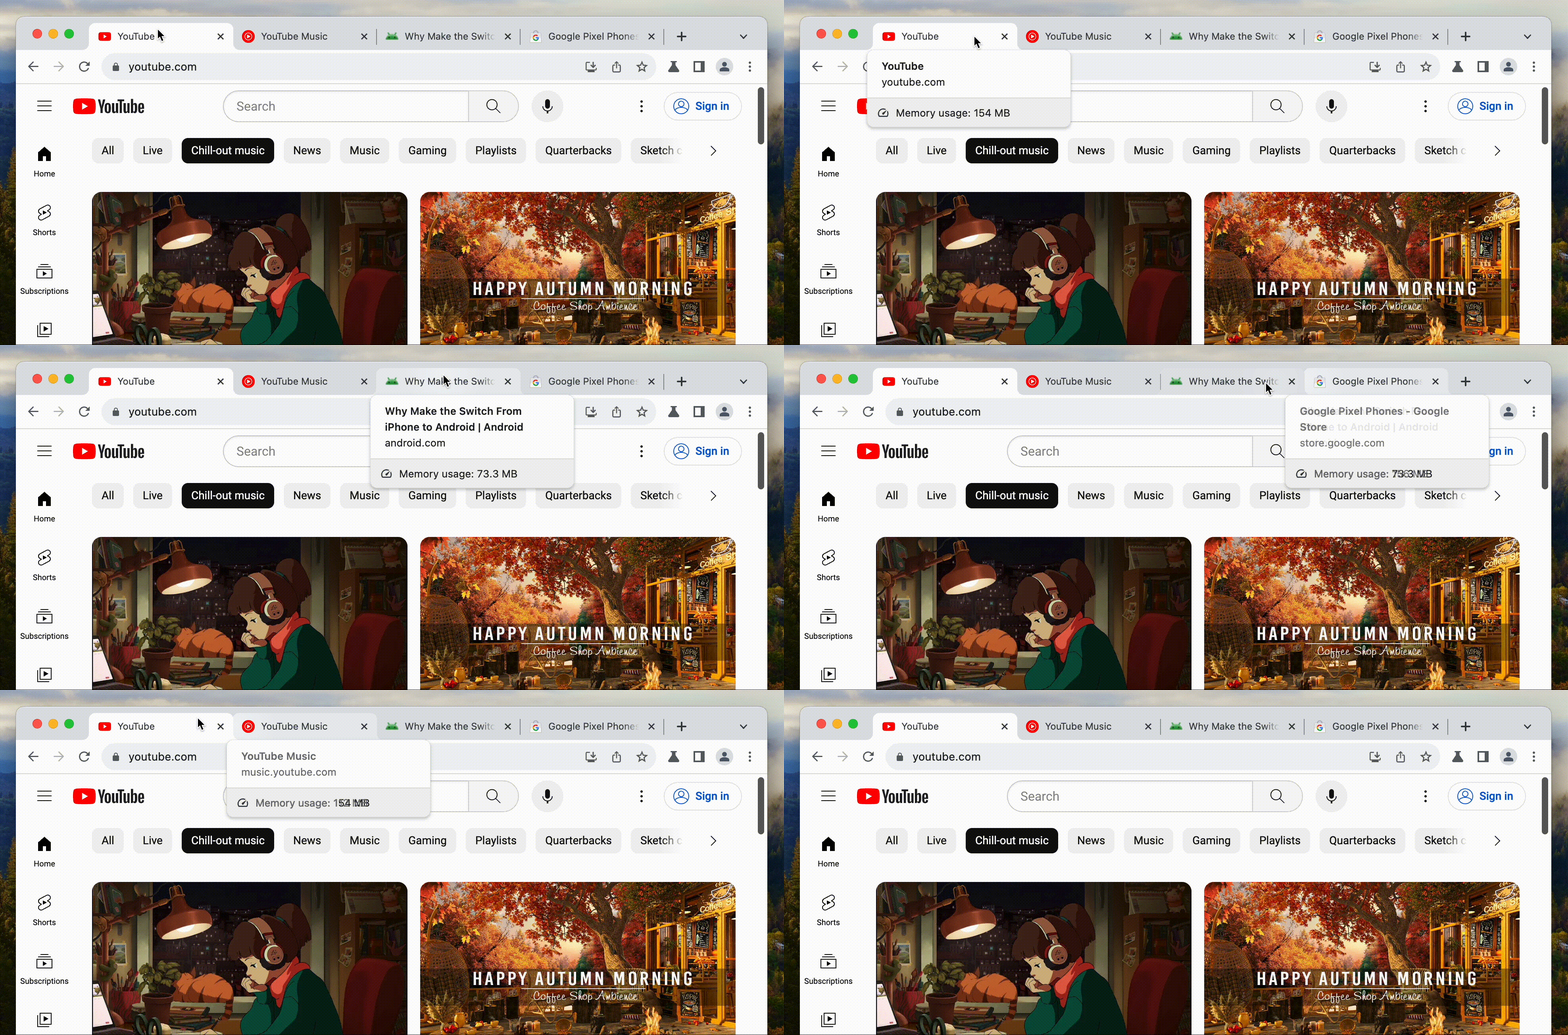
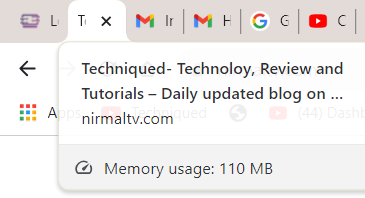
If you are using Google Chrome you can check the memory usage of each tab by just hovering on the tab. You can enable this feature (in case it is not showing up on your Chrome) from Experiments (using about:flags:) using the option Show memory usage in hover cards.

Once you have enabled this feature, hovering on the tabs will show the memory usage of that particular tab.

This will let you decide if you want to close the tab to save the memory usage and freezing of the tab. The current usage indicates memory consumed by the page itself along with any background processes. The state suspension of the tab happens when the Memory Saver function determines the tab has been inactive for a sufficiently long period.

This is a handy feature as you can check which tab is taking up more memory and making the browser lag. Certain websites take up a lot more memory than usual and this feature helps in deciding which tabs to close. Google Chrome also comes with a Performance Monitor that gives high-level, real-time insight into memory usage with other key metrics like CPU utilization, FPS, and DOM nodes.


